

The Support Dashboard serves as your mission control center, providing a high-level overview of your support operations, team performance, and customer trends. By monitoring these metrics, you can identify peak support times, track AI efficiency, and understand your customer demographics in real-time.
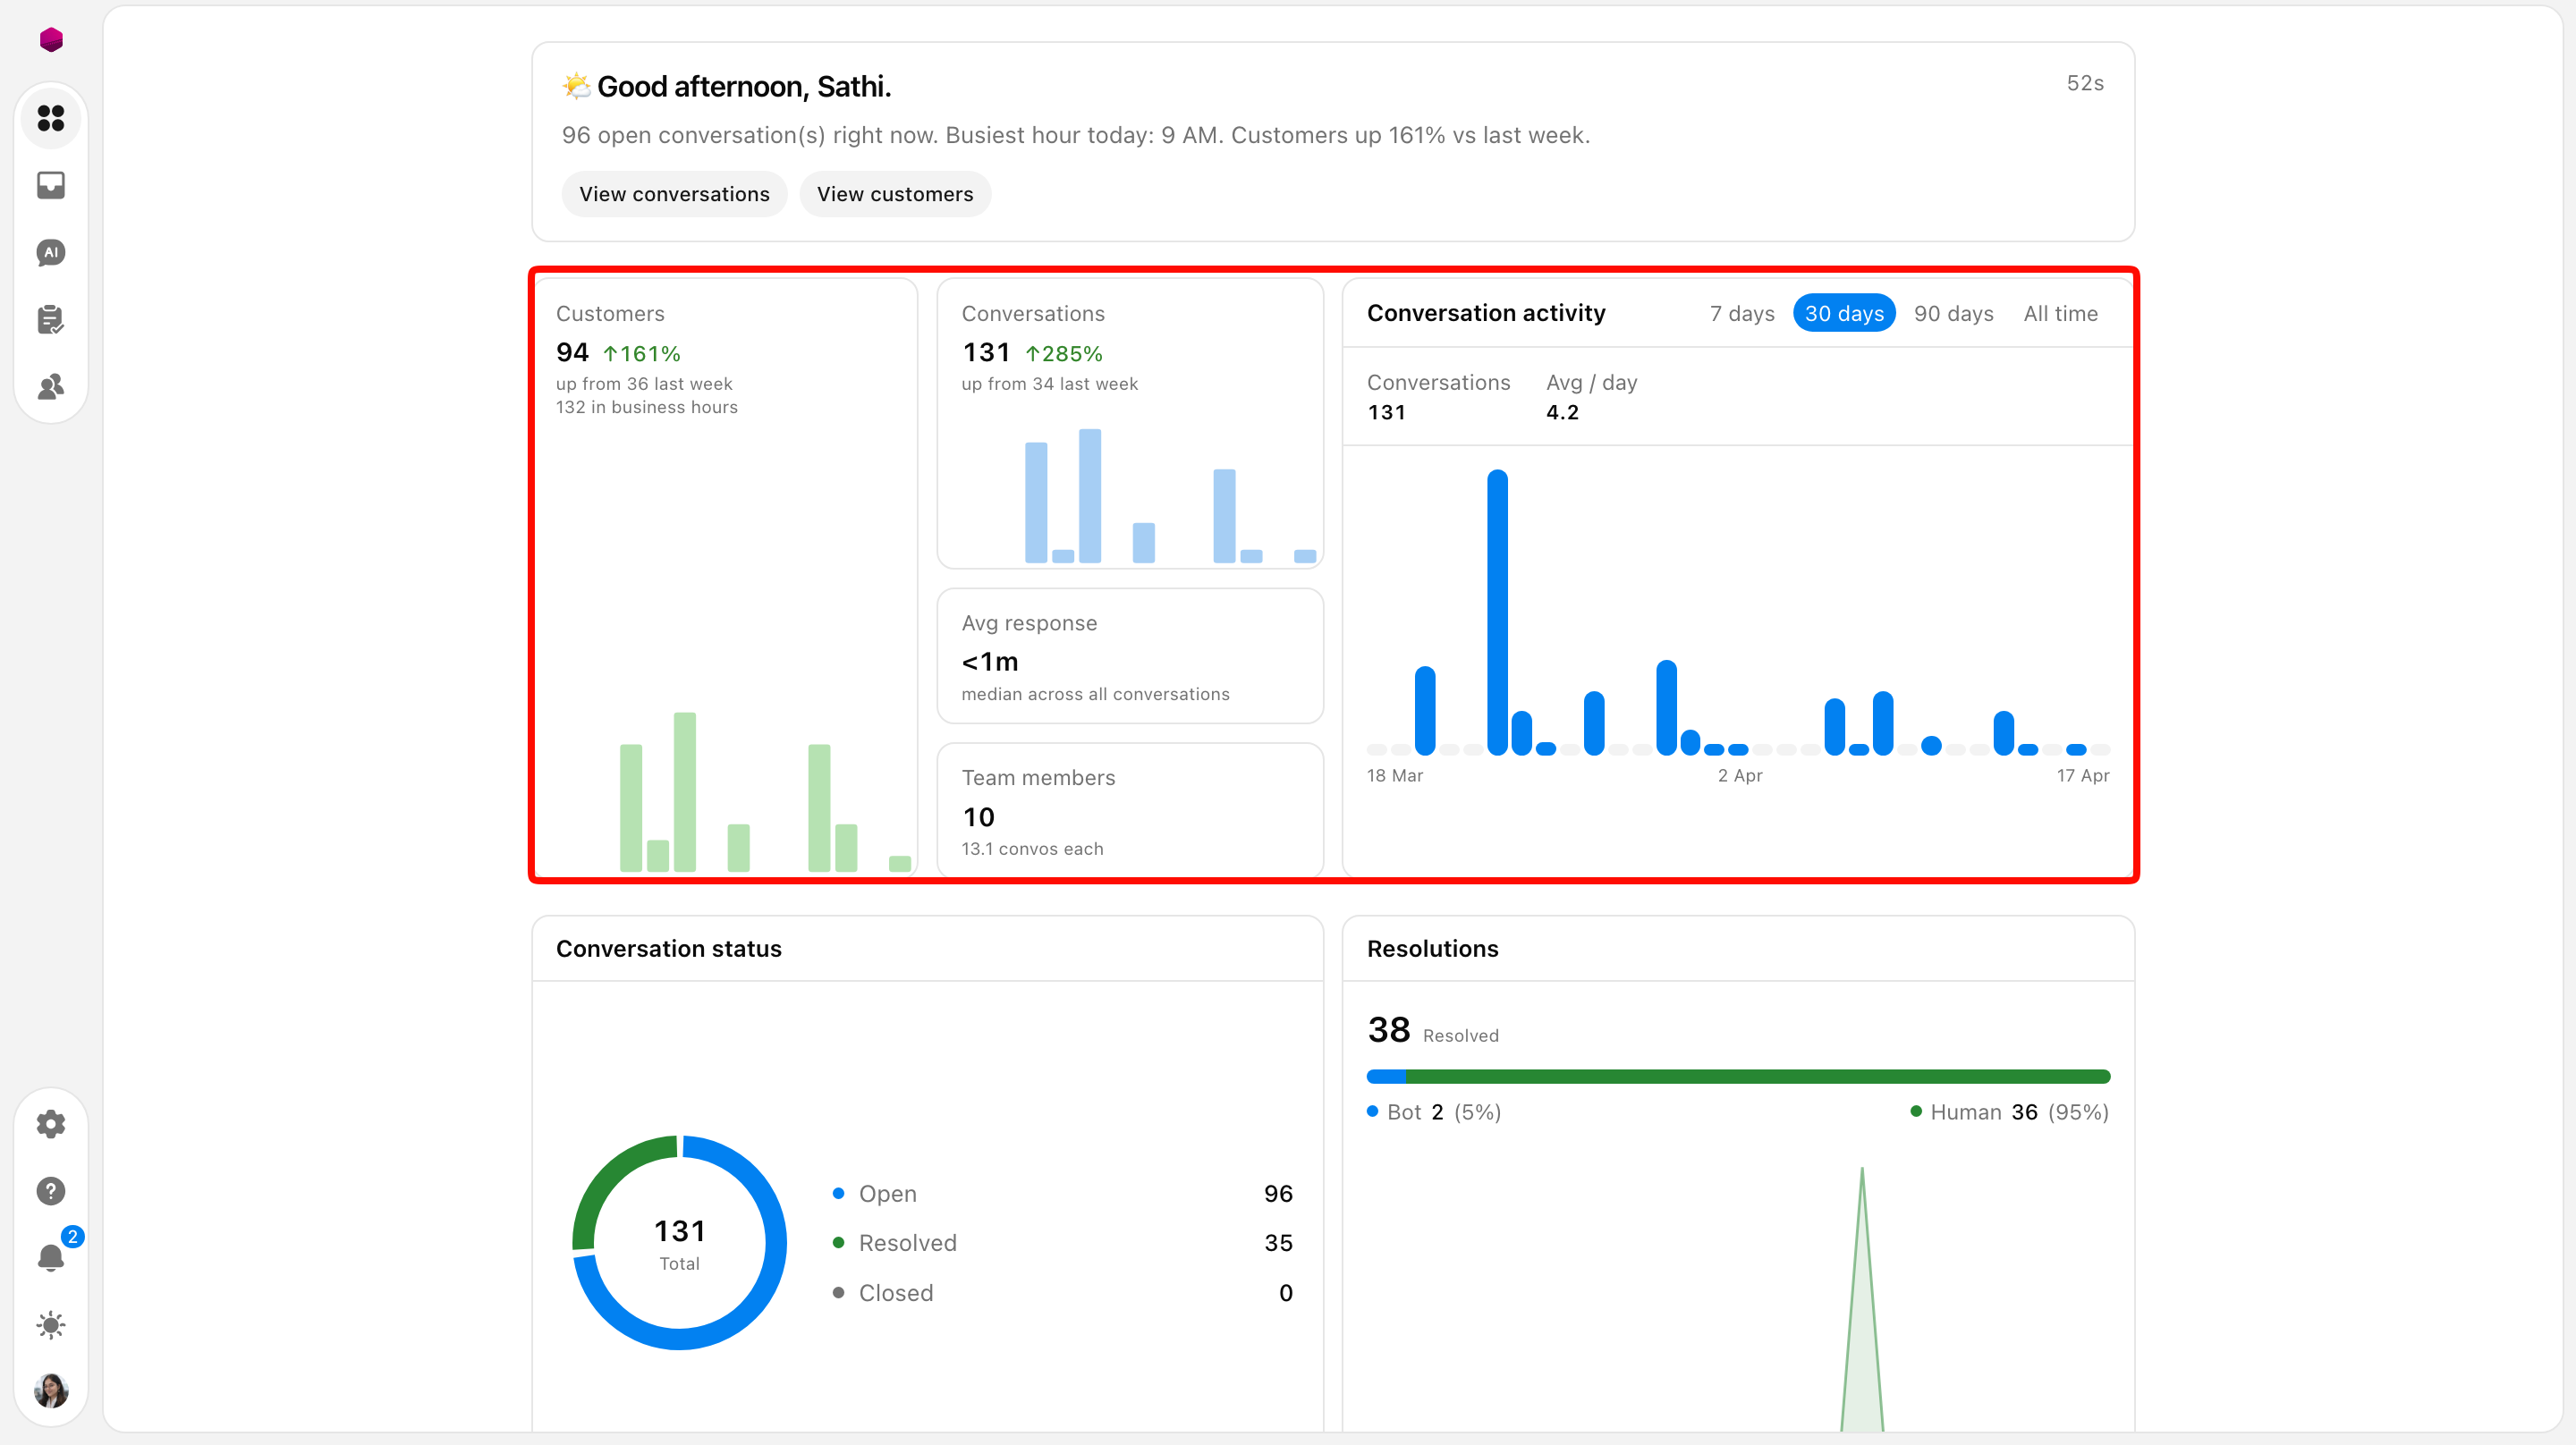
1. Real-Time Activity Overview
At the top of your dashboard, you will find a snapshot of your current workload:
Open Conversations: The total number of active chats currently awaiting a response or resolution.
Busiest Hour: An AI-generated insight identifying when your team faces the highest volume, allowing for better staffing during peak periods.
Growth Trends: Percentage-based comparisons to help you track community growth over time.
2. Conversation & Resolution Metrics
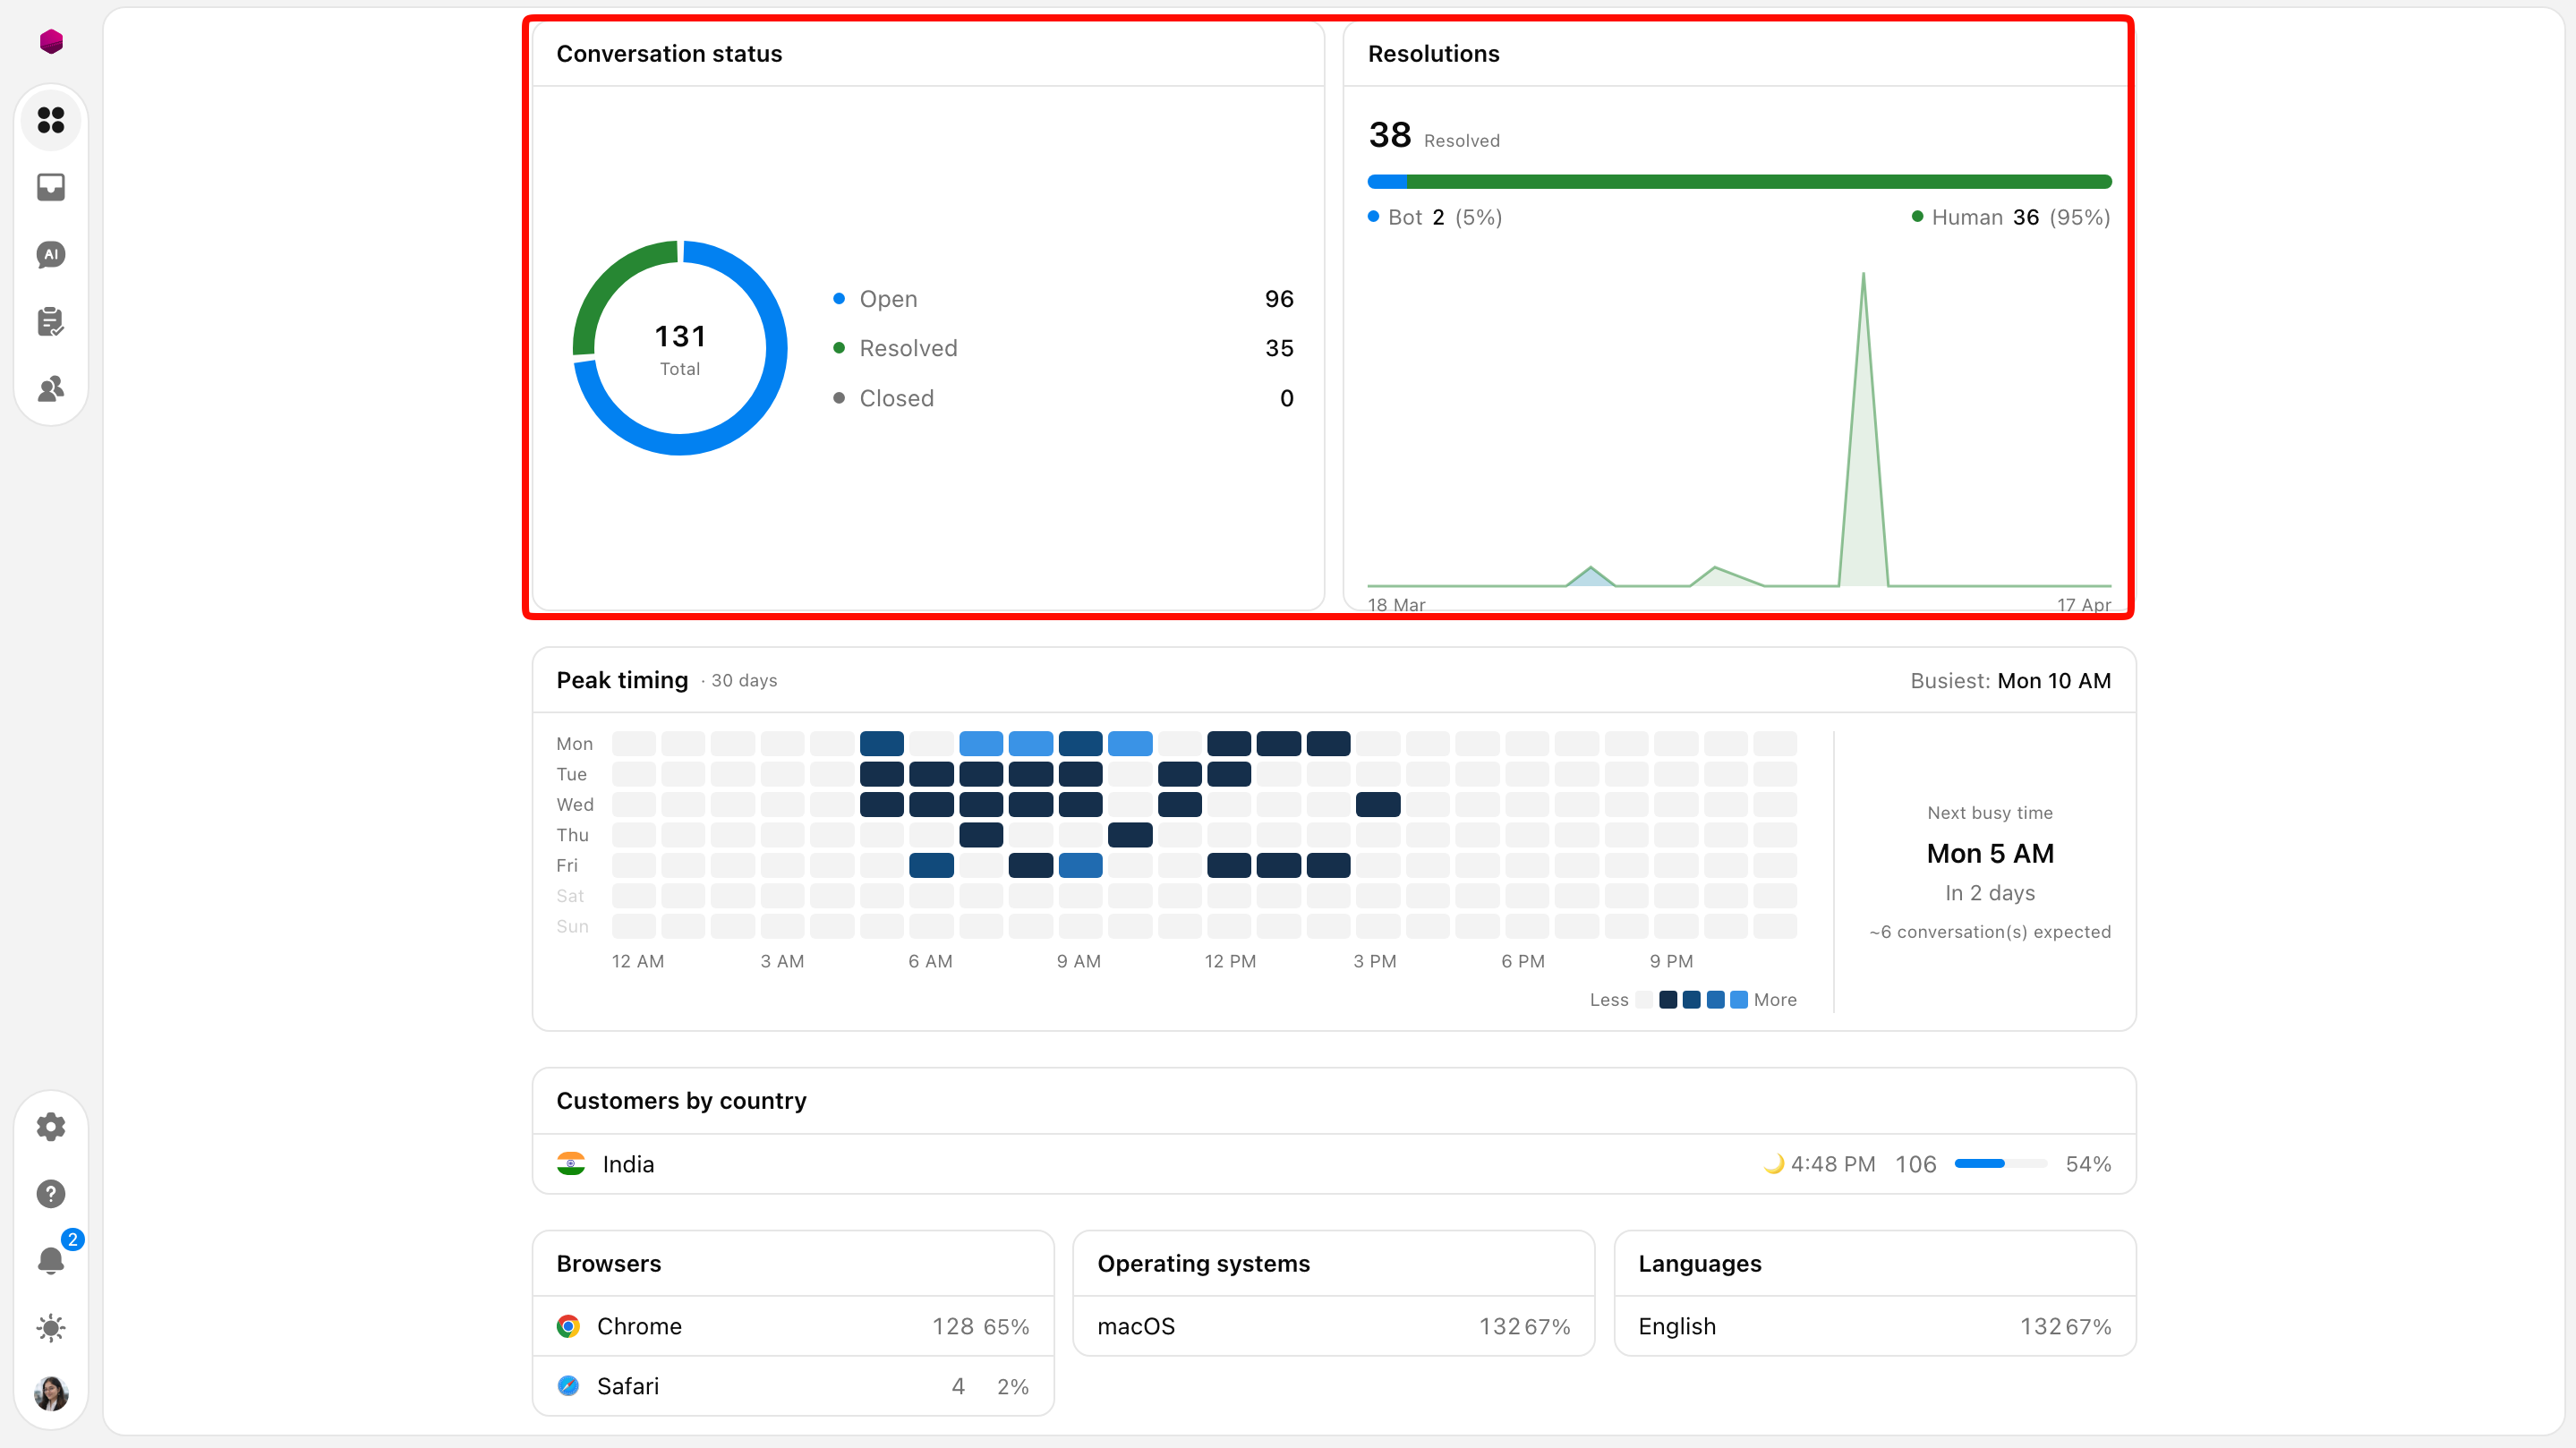
This section breaks down how effectively your team and your AI is handling the influx of messages:
Total Conversations: The cumulative number of inquiries handled within a selected timeframe.
Resolutions (Human vs. Bot): A critical chart showing the percentage of issues resolved by your AI Assistant versus those handled by Human agents. This helps you measure the ROI of your AI automation.
Average Response Time: The median time it takes for a user to receive a reply across all active conversations.
3. Peak Timing & Staffing Insights
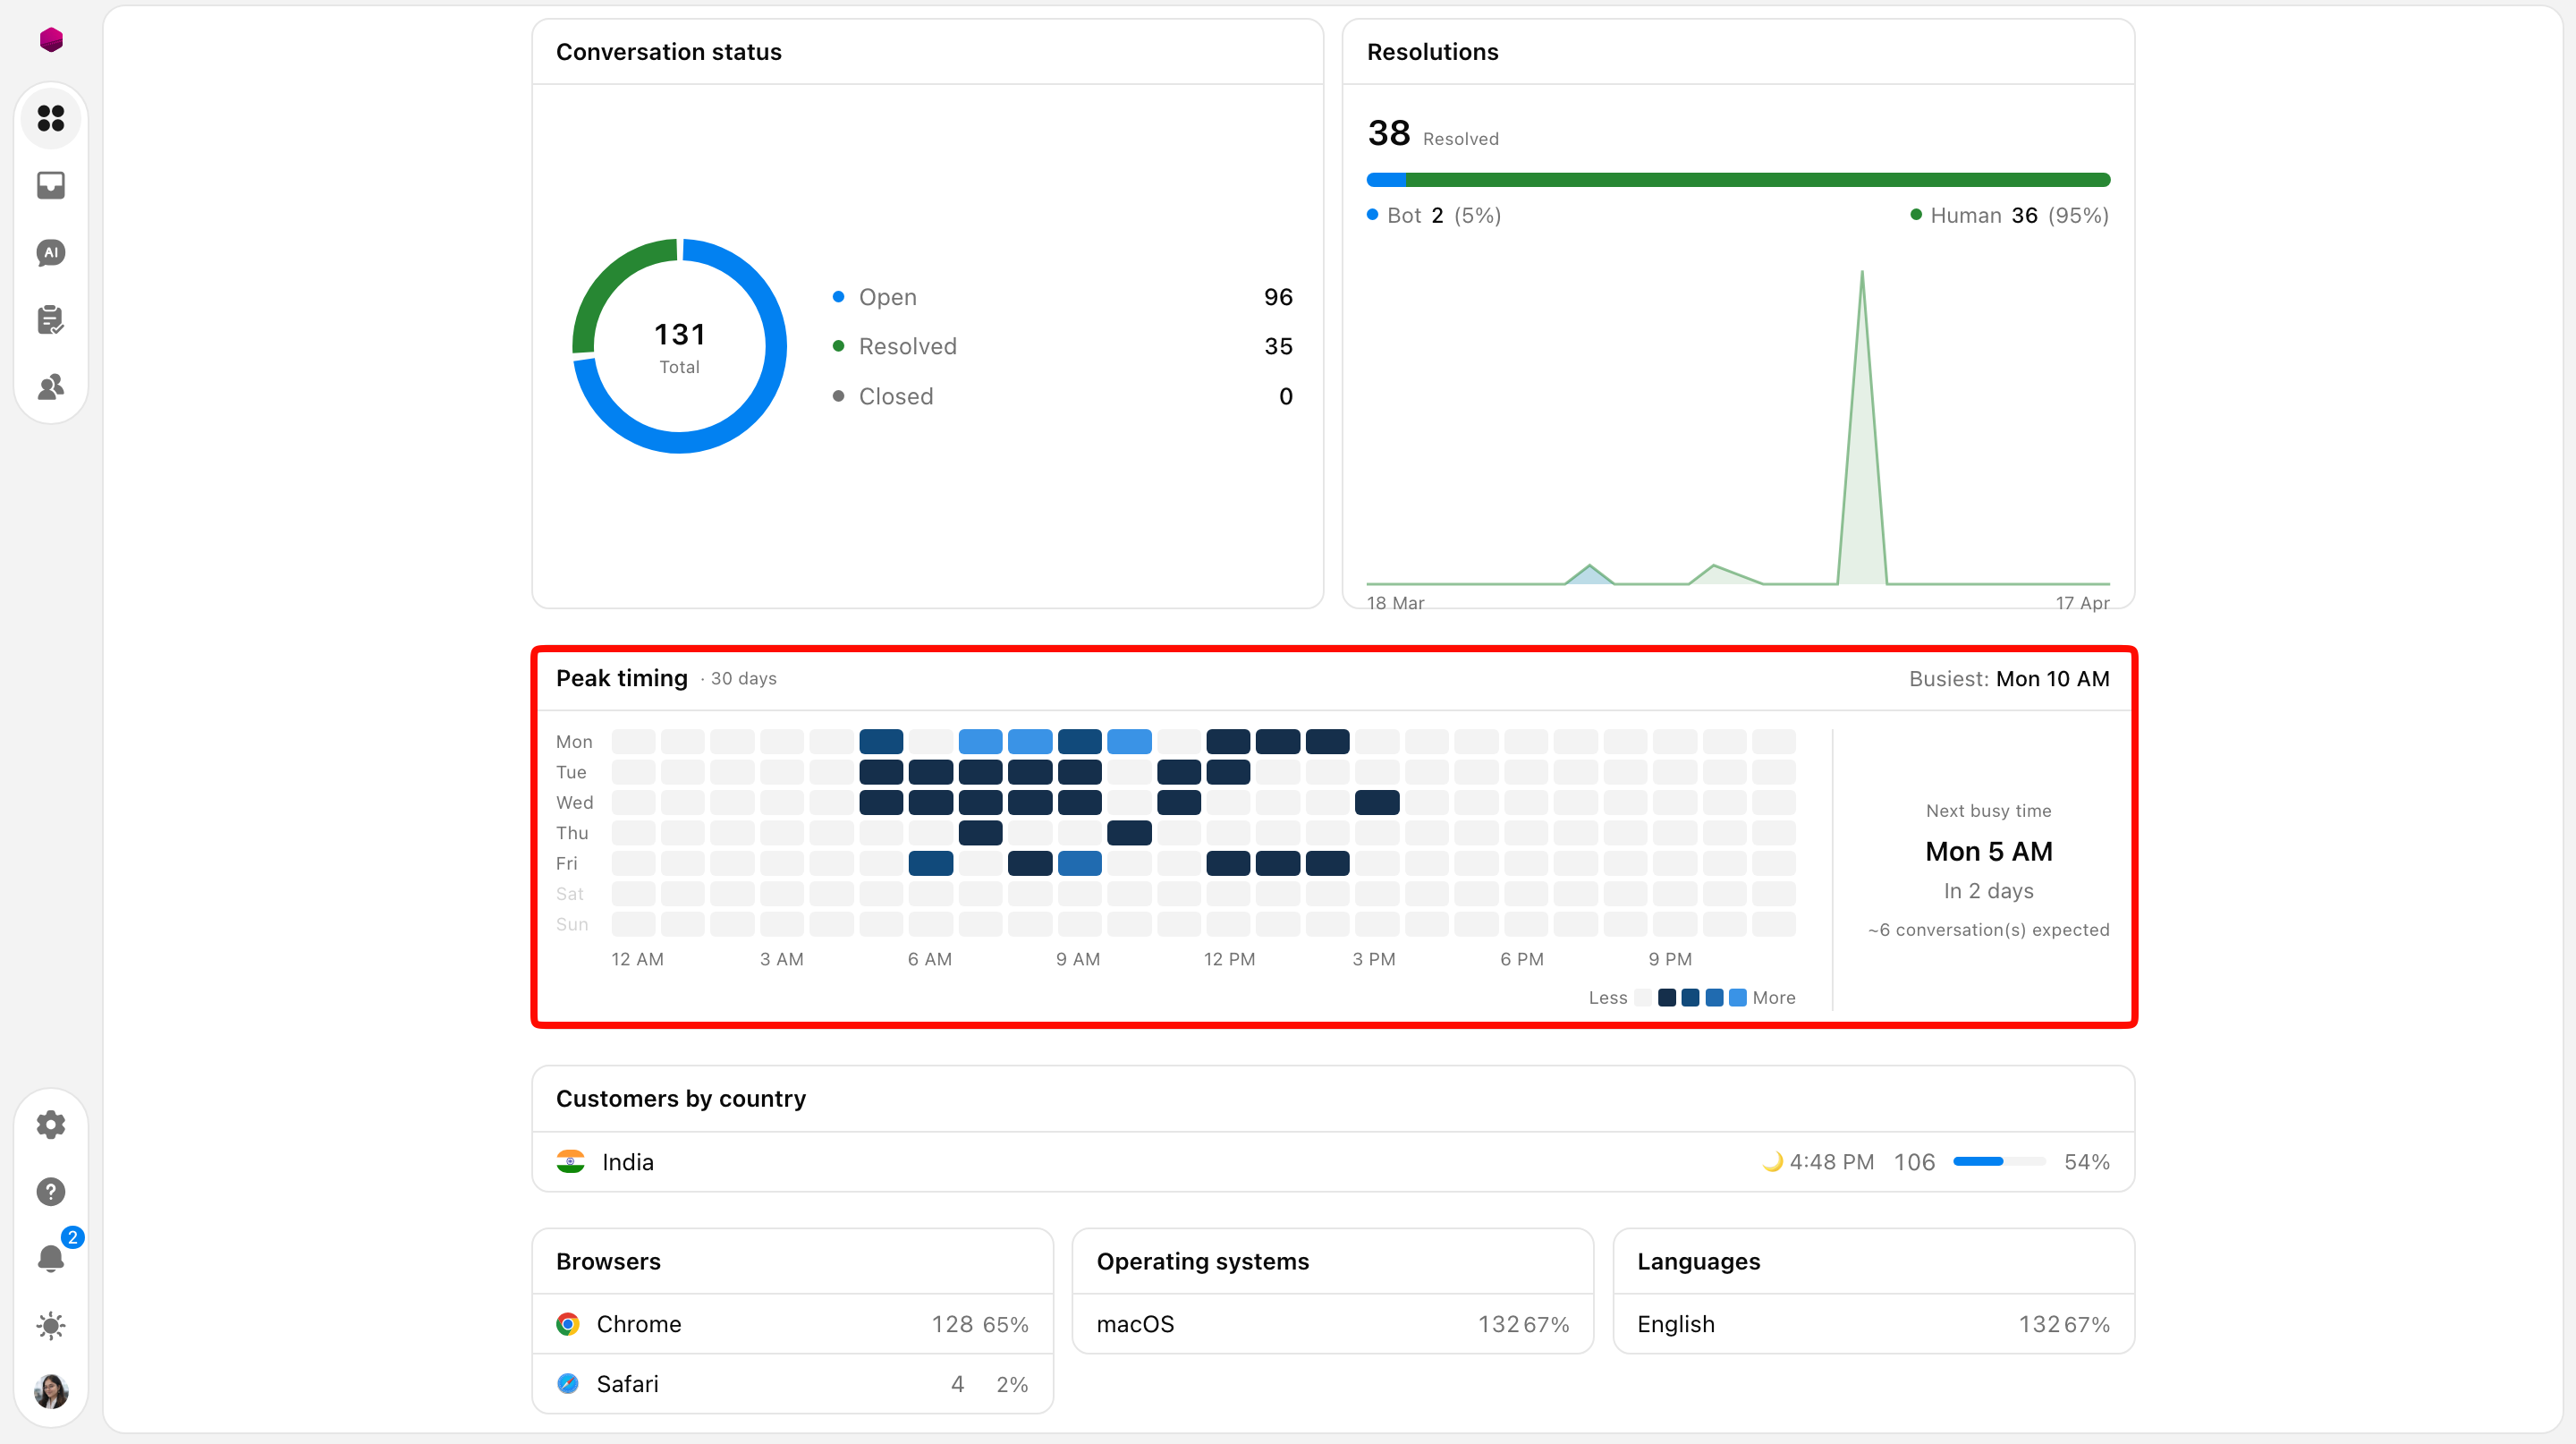
The Peak Timing heat map provides a visual grid of your busiest days and hours over the last 30 days.
Heat Map: Darker blue blocks indicate periods of high conversation volume.
Predictive Insights: The dashboard highlights your "Next busy time" (e.g., "Mon 5 AM") and estimates how many conversations you should expect based on historical data.
4. Customer Demographics & Technology
Understanding who your customers are and what tools they use can help your developers and marketers prioritize their efforts:
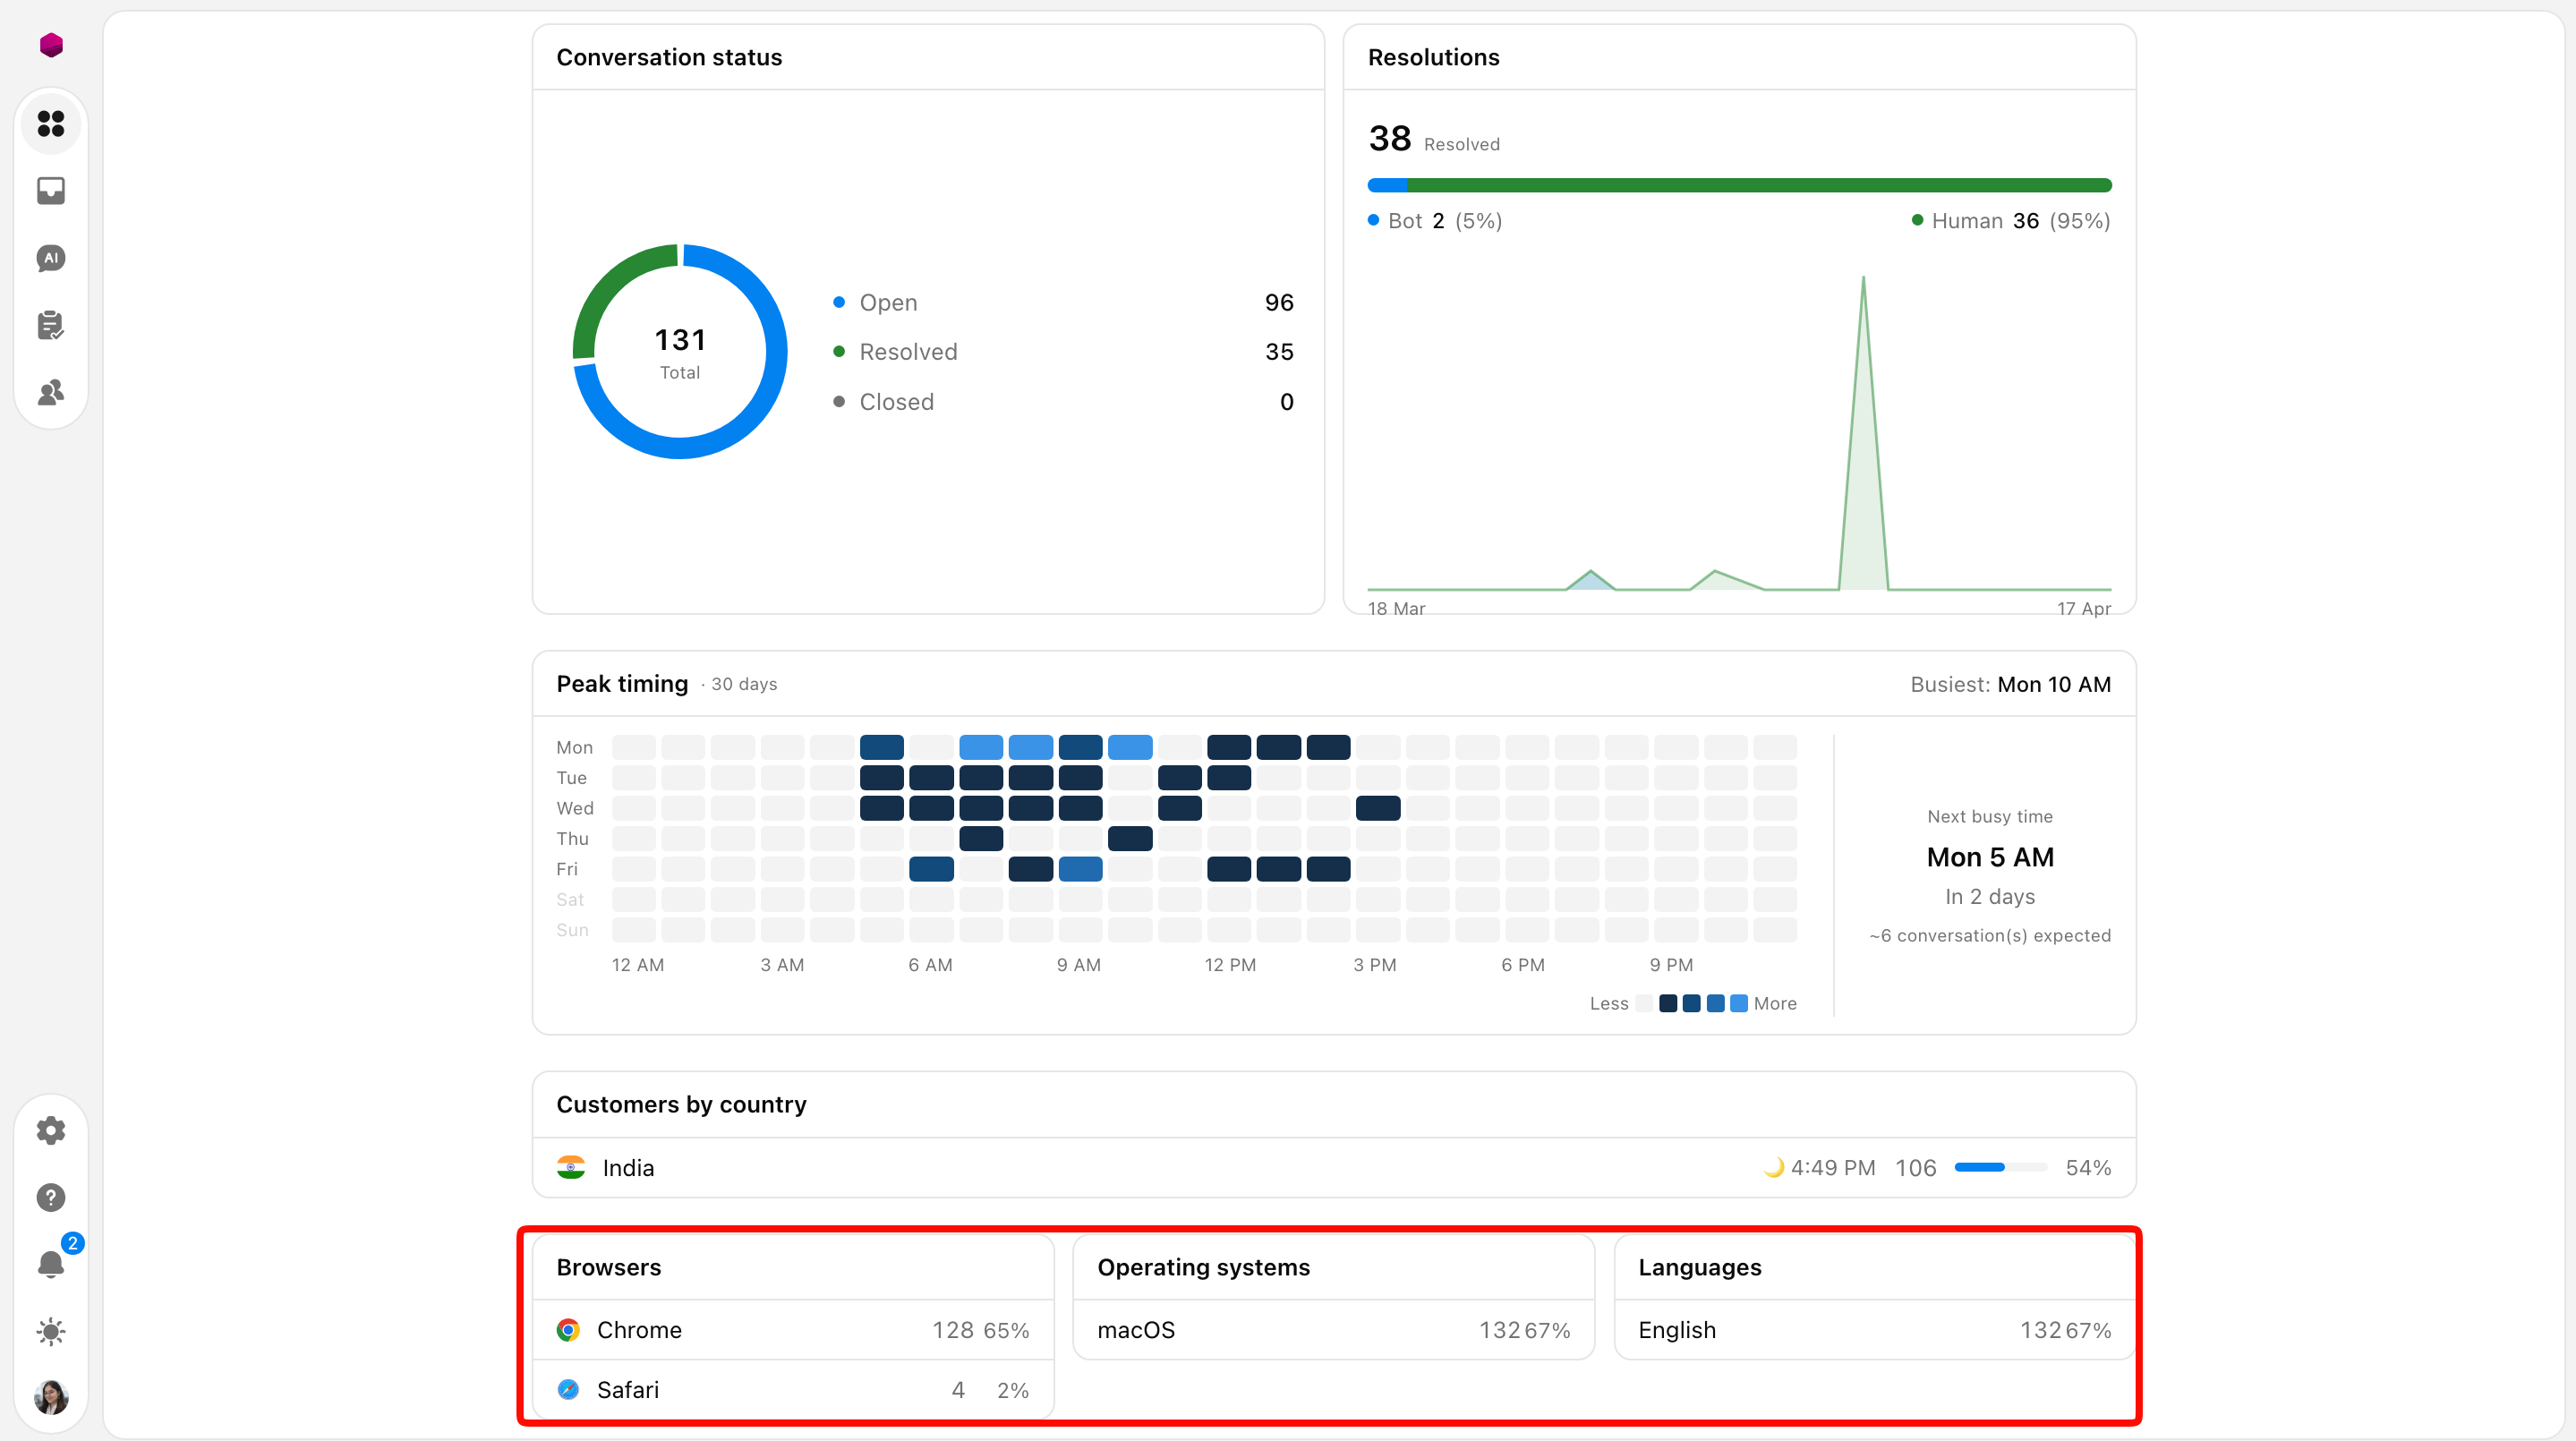
Customers by Country: A breakdown of where your users are messaging from, helping you determine if you need to set up specific Shift Hours for different timezones.
Technical Environment: Statistics on the most popular Browsers (e.g., Chrome, Safari), Operating Systems (e.g., macOS), and Languages used by your audience.
Need more help?
Reach out to our support at [email protected] or submit a request on our support board! 😃
Was this helpful?
Comments
You must be logged in to comment in this article.
Login to comment